Uniswap v3 OHCLV candle price analysis
In this notebook we will show how to download price events from Uniswap V3 to your computer as CSV files and use them to analyse price in each pool. This will generate an OHLCV price chart.
The notebook will fetch price data for all pairs on Uniswap v3 Ethereum which traded at a specific period, or a block range.
Running this notebook will do ~1M API requests on your JSON-RPC provider. You can reduce the scanned block range to decrease the number of API requests.
Running this notebook will be slow (hours), depending how high quality your JSON-RPC provider is. With a local JSON-RPC node it completes in few minutes.
Prerequisites
For more background information, see this blog post about the topic
See here a tutorial how to set up your local development environment to run this notebook
For easier access to data, see also Trading Strategy historical datasets where you can batch download historical data in one file
You need to understand Jupyter Notebook and Pandas basics
You need to understand Ethereum and Web3.py basics
You know how to use Plotly charting library for Python
You will need to have Ethereum API node and its JSON-RPC URL in order to pull out the data from Ethereum blockchain. The notebook will interactively ask you for your API key.
You will need to install web3-ethereum-defi Python package
This notebook uses UNIX style paths and may not run on Microsoft Windows unless modified.
Running
Run the notebook in Visual Studio Code or similar.
To run from the command line using IPython command:
ipython docs/source/tutorials/uniswap-v3-price-analysis.ipynb
To reset the scan state delete /tmp/uniswap-v3-price-scan.json and related CSV files:
rm /tmp/uniswap-v3-*
Extracting and transforming the data
This will extract Uniswap v3 events, save them in temporary CSV files, and then transforms them to OHLCV data.
Download the raw data from Ethereum blockchain
You can sign up for free access to an Ethereum node, see ethereumnodes.com for details. If you run your local run your own Ethereum full node node with transaction receipts retained, the speed up of fetching data is 100x - 1000x.
[2]:
from eth_defi.provider.multi_provider import create_multi_provider_web3
import os
from web3 import Web3, HTTPProvider
# Get your node JSON-RPC URL
# interactively when you run the notebook.
# The actual UI prompt will depend on your environment (Visual Studio Code, Jupyter Notebook, etc.).
# If you are running from command line you can also pass this as JSON_RPC_ETHEREUM environment
# variable
json_rpc_url = os.environ.get("JSON_RPC_ETHEREUM")
if not json_rpc_url:
json_rpc_url = input("Please enter your Ethereum mainnet JSON-RPC URL here: ")
web3 = create_multi_provider_web3(json_rpc_url)
# Configure logging for diagnostics if needed
# import logging
# import sys
# logging.basicConfig(level=logging.DEBUG, stream=sys.stdout)
As an example, here we download raw events from first few blocks after Uniswap V3 was deployed. The events will be stored in several CSV files at /tmp folder.
Depends on your internet connection and latency to the Ethereum node, the scan might take hours. However it can resume in case there is a crash, as we save the last scanned block in a JSON state file.
See the source code of fetch_events_to_csv.
Note: Progress bar might be slow to update at the start.
[3]:
from eth_defi.uniswap_v3.constants import UNISWAP_V3_FACTORY_CREATED_AT_BLOCK
from eth_defi.uniswap_v3.events import fetch_events_to_csv
from eth_defi.event_reader.json_state import JSONFileScanState
# Take a snapshot of 50,000 blocks after Uniswap v3 deployment
start_block = UNISWAP_V3_FACTORY_CREATED_AT_BLOCK
end_block = UNISWAP_V3_FACTORY_CREATED_AT_BLOCK + 10_000 # 250_000
# Stores the last block number of event data we store
state = JSONFileScanState("/tmp/uniswap-v3-price-scan.json")
print(f"Data snapshot range set to {start_block:,} - {end_block:,}")
# Load the events and write them into a CSV file.
# Several different CSV files are created,
# each for one event type: swap, pool created, mint, burn
web3 = fetch_events_to_csv(
json_rpc_url,
state,
start_block=start_block,
end_block=end_block,
output_folder="/tmp",
# Configure depending on what's eth_getLogs
# limit of your JSON-RPC provider and also
# how often you want to see progress bar updates
max_blocks_once=222,
# Do reading and decoding in parallel threads
max_threads=8,
)
Data snapshot range set to 12,369,621 - 12,379,621
No previous scan done, starting fresh from block 12,369,621, total 10,000 blocks
Creating a new CSV file: /tmp/uniswap-v3-poolcreated.csv, with headers: block_number, timestamp, tx_hash, log_index, factory_contract_address, pool_contract_address, fee, token0_address, token0_symbol, token1_address, token1_symbol
Creating a new CSV file: /tmp/uniswap-v3-swap.csv, with headers: block_number, timestamp, tx_hash, log_index, pool_contract_address, amount0, amount1, sqrt_price_x96, liquidity, tick
Creating a new CSV file: /tmp/uniswap-v3-mint.csv, with headers: block_number, timestamp, tx_hash, log_index, pool_contract_address, tick_lower, tick_upper, amount, amount0, amount1
Creating a new CSV file: /tmp/uniswap-v3-burn.csv, with headers: block_number, timestamp, tx_hash, log_index, pool_contract_address, tick_lower, tick_upper, amount, amount0, amount1
Saving Uniswap v3 data for block range 12,369,621 - 12,379,621
Wrote 406 PoolCreated events to /tmp/uniswap-v3-poolcreated.csv
Wrote 8449 Swap events to /tmp/uniswap-v3-swap.csv
Wrote 3706 Mint events to /tmp/uniswap-v3-mint.csv
Wrote 467 Burn events to /tmp/uniswap-v3-burn.csv
JSON-RPC API usage
Show how many API calls we made to our JSON-RPC provider.
It’s important to follow your API usage counts, as most commercial vendors charge or limit you be the API request count.
[4]:
import pandas as pd
api_call_counts = web3.get_api_call_counts()
data = [(k, v) for k, v in api_call_counts.items()]
df = pd.DataFrame(
data,
columns=[
"Endpoint",
"Number of JSON-RPC API calls",
],
)
df = df.set_index("Endpoint")
display(df)
| Number of JSON-RPC API calls | |
|---|---|
| Endpoint | |
| eth_chainId | 1 |
| web3_clientVersion | 1 |
| eth_call | 1227 |
Analysing Uniswap v3 price data
In Uniswap V3, you can get the current price of any pool from any given moment using swap events.
[5]:
swap_df = pd.read_csv("/tmp/uniswap-v3-swap.csv")
print(f"We have total {len(swap_df):,} Uniswap swap events in the loaded dataset")
column_names = ", ".join([n for n in swap_df.columns])
print("Swap data columns are:", column_names)
We have total 8,449 Uniswap swap events in the loaded dataset
Swap data columns are: block_number, timestamp, tx_hash, log_index, pool_contract_address, amount0, amount1, sqrt_price_x96, liquidity, tick
Choose a pool to analyse, for example: USDC/ETH 0.3%. You can find pool addresses on Uniswap v3 info site.
[6]:
from eth_defi.uniswap_v3.pool import fetch_pool_details
pool_address = "0x8ad599c3A0ff1De082011EFDDc58f1908eb6e6D8"
pool_details = fetch_pool_details(web3, pool_address)
print(pool_details)
print("token0 is", pool_details.token0)
print("token1 is", pool_details.token1)
Pool 0x8ad599c3A0ff1De082011EFDDc58f1908eb6e6D8 is USDC-WETH, with the fee 0.3000%
token0 is <USD Coin (USDC) at 0xA0b86991c6218b36c1d19D4a2e9Eb0cE3606eB48, 6 decimals, on chain 1>
token1 is <Wrapped Ether (WETH) at 0xC02aaA39b223FE8D0A0e5C4F27eAD9083C756Cc2, 18 decimals, on chain 1>
Extract the swaps of this pool from the Uniswap v3 full dataset of all pools.
[7]:
df = swap_df.loc[swap_df["pool_contract_address"] == pool_address.lower()]
df
[7]:
| block_number | timestamp | tx_hash | log_index | pool_contract_address | amount0 | amount1 | sqrt_price_x96 | liquidity | tick | |
|---|---|---|---|---|---|---|---|---|---|---|
| 19 | 12371376 | 2021-05-05 01:56:23 | 0xce7c3c307d820785caa12938012372fc9366a614a6aa... | 26 | 0x8ad599c3a0ff1de082011efddc58f1908eb6e6d8 | -329608 | 100000000000000 | 1377932816571815120446551350158799 | 4303369674465501 | 195285 |
| 21 | 12373132 | 2021-05-05 08:23:26 | 0x9a1c51b0bffbf840948f3b6e3f3e495ba1cd3fa64854... | 192 | 0x8ad599c3a0ff1de082011efddc58f1908eb6e6d8 | -164694492 | 50000000000000000 | 1378850591292581266780357299649652 | 4303369674465501 | 195298 |
| 25 | 12373520 | 2021-05-05 09:50:51 | 0xc58715c62a5bf70a6ca09f0e51546d6cad76c8d4fff0... | 8 | 0x8ad599c3a0ff1de082011efddc58f1908eb6e6d8 | -329169 | 100000000000000 | 1378852426842022799073024911548633 | 4303369674465501 | 195298 |
| 26 | 12374077 | 2021-05-05 11:59:57 | 0x288c21b8b4fbf449b1d086a06e43b124ac2bc088c3f5... | 86 | 0x8ad599c3a0ff1de082011efddc58f1908eb6e6d8 | 2 | -329169 | 1378852426842016741051966412054516 | 4304946248093346 | 195298 |
| 27 | 12374320 | 2021-05-05 12:56:56 | 0x67502d8ba373287f6d301f6baa77c5a5f4c80d0753c3... | 257 | 0x8ad599c3a0ff1de082011efddc58f1908eb6e6d8 | 1559137299 | -467880854065813753 | 1370241555019945317645788135487819 | 4304946248093346 | 195173 |
| ... | ... | ... | ... | ... | ... | ... | ... | ... | ... | ... |
| 8361 | 12379582 | 2021-05-06 08:12:20 | 0x88408621cd4ead7bb3e5e6d34f330e2703fcae585544... | 191 | 0x8ad599c3a0ff1de082011efddc58f1908eb6e6d8 | -2000000000 | 583299076342134361 | 1351017547982248304006732547277638 | 2328408148579177624 | 194890 |
| 8379 | 12379587 | 2021-05-06 08:13:22 | 0x058c774d6fe5004ff4b8e0170b0c22d6a55174075997... | 115 | 0x8ad599c3a0ff1de082011efddc58f1908eb6e6d8 | 68778217310 | -19929244808827805240 | 1350339420546788216436548210768487 | 2328408148579177624 | 194880 |
| 8384 | 12379591 | 2021-05-06 08:13:42 | 0x2c75c4f988636defd800e9db416b6052a919af499c38... | 82 | 0x8ad599c3a0ff1de082011efddc58f1908eb6e6d8 | -2078153696 | 605502293393303236 | 1350359822809089059582119435451537 | 2344294710858444331 | 194880 |
| 8442 | 12379619 | 2021-05-06 08:18:23 | 0x5b31c021dde48d89ef2df60aa7b971069a160fe1696c... | 89 | 0x8ad599c3a0ff1de082011efddc58f1908eb6e6d8 | -274564529 | 80000000000000000 | 1350362515329497666265196327383179 | 2346960202024163276 | 194880 |
| 8445 | 12379619 | 2021-05-06 08:18:23 | 0x4bc5f0dd3d799bc445b5c91b384cf3e7e2f26637a109... | 222 | 0x8ad599c3a0ff1de082011efddc58f1908eb6e6d8 | -2794364453 | 814213470967425221 | 1350389918909341944733242073351287 | 2346960202024163276 | 194881 |
475 rows × 10 columns
In Uniswap V3, we can get pool’s price from pool’s tick.
[8]:
def convert_price(row):
# USDC/WETH pool has reverse token order, so let's flip it WETH/USDC
tick = row["tick"]
return float(pool_details.convert_price_to_human(tick, reverse_token_order=True))
def convert_value(row):
# USDC is token0 and amount0
return abs(float(row["amount0"])) / (10**pool_details.token0.decimals)
df = df.copy(deep=True) # https://stackoverflow.com/a/60885847/315168
df["price"] = df.apply(convert_price, axis=1)
df["value"] = df.apply(convert_value, axis=1)
display(df[["block_number", "timestamp", "tick", "price", "value"]])
| block_number | timestamp | tick | price | value | |
|---|---|---|---|---|---|
| 19 | 12371376 | 2021-05-05 01:56:23 | 195285 | 3306.010571 | 0.329608 |
| 21 | 12373132 | 2021-05-05 08:23:26 | 195298 | 3301.715764 | 164.694492 |
| 25 | 12373520 | 2021-05-05 09:50:51 | 195298 | 3301.715764 | 0.329169 |
| 26 | 12374077 | 2021-05-05 11:59:57 | 195298 | 3301.715764 | 0.000002 |
| 27 | 12374320 | 2021-05-05 12:56:56 | 195173 | 3343.244146 | 1559.137299 |
| ... | ... | ... | ... | ... | ... |
| 8361 | 12379582 | 2021-05-06 08:12:20 | 194890 | 3439.204594 | 2000.000000 |
| 8379 | 12379587 | 2021-05-06 08:13:22 | 194880 | 3442.645347 | 68778.217310 |
| 8384 | 12379591 | 2021-05-06 08:13:42 | 194880 | 3442.645347 | 2078.153696 |
| 8442 | 12379619 | 2021-05-06 08:18:23 | 194880 | 3442.645347 | 274.564529 |
| 8445 | 12379619 | 2021-05-06 08:18:23 | 194881 | 3442.301117 | 2794.364453 |
475 rows × 5 columns
Then we convert individual swap events to OHLC candles. We use 4h time frame here.
[9]:
from eth_defi.research.candle import convert_to_ohlcv_candles
candles = convert_to_ohlcv_candles(df, pd.Timedelta("4h"))
# Show only 100 first candles
candles = candles.head(100)
display(candles)
| open | high | low | close | volume | |
|---|---|---|---|---|---|
| timestamp | |||||
| 2021-05-05 00:00:00 | 3306.010571 | 3306.010571 | 3306.010571 | 3306.010571 | 3.296080e-01 |
| 2021-05-05 04:00:00 | NaN | NaN | NaN | NaN | 0.000000e+00 |
| 2021-05-05 08:00:00 | 3301.715764 | 3301.715764 | 3301.715764 | 3301.715764 | 1.650237e+02 |
| 2021-05-05 12:00:00 | 3343.244146 | 3343.244146 | 3343.244146 | 3343.244146 | 1.559137e+03 |
| 2021-05-05 16:00:00 | 3343.244146 | 3476.895080 | 3343.244146 | 3430.617750 | 1.381694e+05 |
| 2021-05-05 20:00:00 | 3434.049912 | 3540.042657 | 3422.394550 | 3521.330996 | 2.147157e+06 |
| 2021-05-06 00:00:00 | 3517.811601 | 3522.035298 | 3371.781406 | 3470.989674 | 2.706853e+06 |
| 2021-05-06 04:00:00 | 3470.989674 | 3495.021115 | 3407.029141 | 3424.448500 | 2.933632e+06 |
| 2021-05-06 08:00:00 | 3425.133424 | 3442.645347 | 3425.133424 | 3442.301117 | 3.739259e+05 |
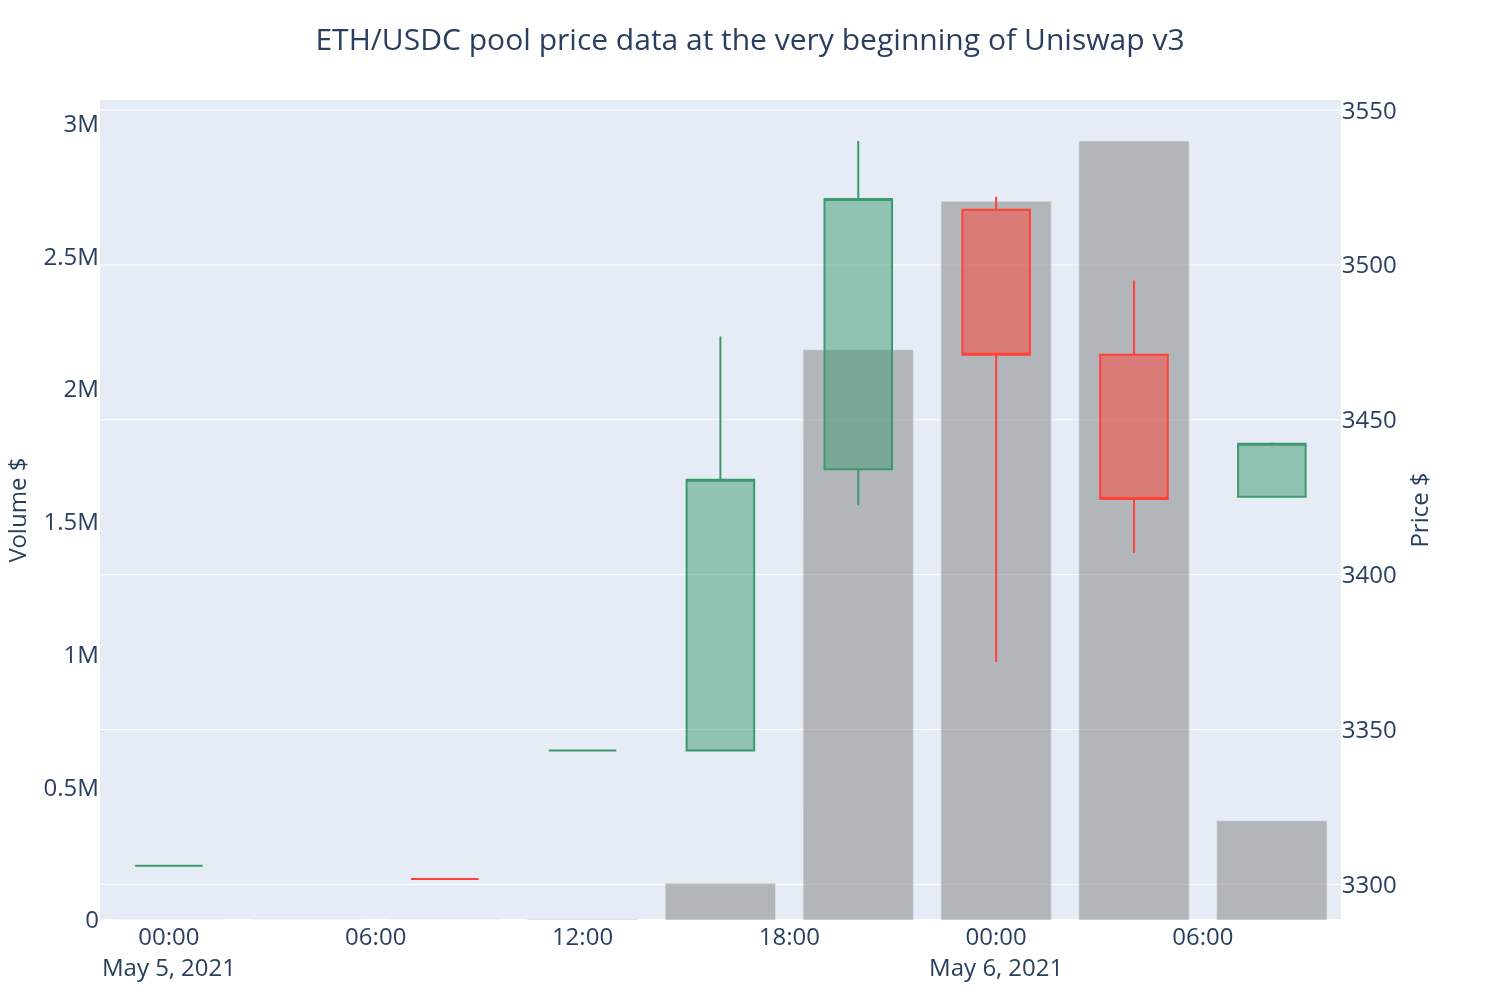
Drawing OHLCV chart
Now we can plot the OHLC chart using Plotly.
[10]:
# To make the output a static image instead of dynamic, we need these 3 lines
from eth_defi.research.notebook import setup_charting_and_output, OutputMode, set_large_plotly_chart_font
setup_charting_and_output(OutputMode.static, image_format="png", width=1500, height=1000, increase_font_size=False)
set_large_plotly_chart_font()
import plotly.graph_objects as go
from plotly.subplots import make_subplots
candlesticks = go.Candlestick(
x=candles.index,
open=candles["open"],
high=candles["high"],
low=candles["low"],
close=candles["close"],
showlegend=False,
)
volume_bars = go.Bar(
x=candles.index,
y=candles["volume"],
showlegend=False,
marker={
"color": "rgba(128,128,128,0.5)",
},
)
fig = go.Figure(candlesticks)
fig = make_subplots(specs=[[{"secondary_y": True}]])
fig.add_trace(candlesticks, secondary_y=True)
fig.add_trace(volume_bars, secondary_y=False)
fig.update_layout(
title="ETH/USDC pool price data at the very beginning of Uniswap v3",
height=800,
# Hide Plotly scrolling minimap below the price chart
xaxis={"rangeslider": {"visible": False}},
)
fig.update_yaxes(title="Price $", secondary_y=True, showgrid=True)
fig.update_yaxes(title="Volume $", secondary_y=False, showgrid=False)
fig.show()
[ ]: