GMX Price Analysis Using eth_defi’s native GMX Integration
This tutorial demonstrates how to analyse price data from GMX, a decentralised perpetual exchange built on Arbitrum. GMX allows users to trade perpetual contracts for various cryptocurrencies with up to 100x leverage.
Overview
GMX is a decentralised exchange that provides:
Spot and perpetual trading for cryptocurrencies like ETH, BTC, LINK, ARB & many more
Multi-asset liquidity pools (GLP/GM tokens) that provide deep liquidity
Zero-slippage trading through price feeds from Chainlink oracles
Competitive trading fees and robust liquidation mechanisms
Cross-margin trading with isolated risk management
What this tutorial covers: - Connecting to GMX’s smart contracts on Arbitrum - Fetching historical OHLC (Open, High, Low, Close) price data - Retrieving market information, including Total Value Locked (TVL) - Creating candlestick charts with market context - Analysing price ranges and market statistics
Prerequisites
For more background information, see this blog post about the topic
See here a tutorial how to set up your local development environment to run this notebook
For easier access to data, see also Trading Strategy historical datasets where you can batch download historical data in one file
You need to understand Jupyter Notebook and Pandas basics
You need to understand Ethereum and Web3.py basics
You know how to use Plotly charting library for Python
You will need to have Ethereum API node and its JSON-RPC URL in order to pull out the data from Ethereum blockchain. The notebook will interactively ask you for your API key.
You will need to install web3-ethereum-defi Python package
This notebook uses UNIX style paths and may not run on Microsoft Windows unless modified.
Once you have the environment setup install the necessary dependencies using the following command
pip install web3-ethereum-defi[data]
You’ll also need: - Access to an Arbitrum RPC endpoint (Alchemy, Infura, or public) - Basic familiarity with pandas and plotly
How to run this tutorial:
Set up your environment with the
ARBITRUM_CHAIN_JSON_RPCenvironment variableImport and run the analysis functions
Charts will be displayed showing price movements and market metrics
By the end of this tutorial, you’ll be able to create comprehensive price analysis reports for any token available on GMX.
Setting Up Your Environment
Create a .env file in your project directory or set environment variables:
# Set your Arbitrum RPC URL
export ARBITRUM_CHAIN_JSON_RPC="https://arb1.arbitrum.io/rpc"
For production use, consider using private RPC endpoints for better reliability and rate limits.
Running
Run the notebook in Visual Studio Code or similar.
To run from the command line using the IPython command:
ipython docs/source/tutorials/gmx-v2-price-analysis.ipynb
Setting up the Connection
First, let’s establish our connection to the Arbitrum network and create a GMX configuration:
[1]:
import os
from eth_defi.provider.multi_provider import create_multi_provider_web3
from eth_defi.gmx.config import GMXConfig
# Setup connection to Arbitrum
json_rpc_url = os.environ.get("ARBITRUM_CHAIN_JSON_RPC")
if not json_rpc_url:
json_rpc_url = input("Please enter your Arbitrum JSON-RPC URL: ")
web3 = create_multi_provider_web3(json_rpc_url)
config = GMXConfig(web3)
print(f"Connected to chain {web3.eth.chain_id}")
Connected to chain 42161
Understanding GMX Data Sources
GMX data comes from two primary sources:
1. GMX API (Centralised)
OHLC price data: Pre-aggregated candlestick data
Token price data: Token prices from chainlink price feeds
Endpoint:
https://arbitrum-api.gmxinfra.io/Data span: Historical time series
No volume data: Only timestamp, open, high, low, close
2. On-Chain Contracts
TVL data: Total Value Locked in liquidity pools
Open Interest: Outstanding position values
Market information: Available trading pairs
Latency: Real-time (latest block)
Getting The Price for A Token
GMX uses Chainlink Price Feeds to get the latest prices for a token listed on their exchange. They provide an API endpoint to get the prices quickly and efficiently.
Stablecoin Pricing
In case the price of a stablecoin depegs from 1 USD:
- For stablecoin tokens, there may be a spread from the Chainlink price of the stablecoin to 1 USD. If Chainlink Data Stream prices are used then the spread would be from the data stream and may not be to 1 USD.
For token prices GMX handles the decimals differnetly. The chainlink price feeds returns the data in terms of 18 decimals(N.B. For most tokens but not for all tokens). And GMX uses 30 decimals. So in order to get the data in terms of human readable format we need to use the following formula
human_readable_price = raw_price / (10 ** (30 - token_decimals))
The prices are in raw format so we need to format them based on the decimals. Below we can see how we can use eth_defi’s GMXAPI class to get that data and structure it in a human readable way:
[ ]:
import pandas as pd
import numpy as np
from decimal import Decimal
from eth_defi.gmx.api import GMXAPI
from eth_defi.gmx.config import GMXConfig
from eth_defi.provider.multi_provider import create_multi_provider_web3
import os
import random
# Token decimals. For the sake of this example only selected 10 tokens
TOKEN_DECIMALS = {
"ETH": 18,
"USDC": 6,
"USDT": 6,
"DAI": 18,
"BTC": 8,
"LINK": 18,
"UNI": 18,
"SOL": 9,
"SHIB": 18,
"APE": 18,
}
def determine_price_decimals(token_symbol: str, raw_price: str) -> int:
"""
Guess how many decimals to divide raw_price by, to get a USD‐price.
Uses GMX's 30 decimal standard, adjusted by token's ERC20 decimals.
"""
price_int = int(raw_price)
token_decimals = TOKEN_DECIMALS.get(token_symbol, 18) # default 18
# GMX scale factor (30 decimals)
gmx_scale = 30
# To convert: human_price = raw / (10 ** (gmx_scale - token_decimals))
# So decimals_to_divide = gmx_scale - token_decimals
decimals_to_divide = gmx_scale - token_decimals
return decimals_to_divide
def scale_price(token_symbol: str, raw_price: str) -> float:
"""
Convert the raw price to human readable USD price.
"""
decimals = determine_price_decimals(token_symbol, raw_price)
price_int = int(raw_price)
human_price = price_int / (10 ** decimals)
return human_price
def convert_gmx_price(token_symbol: str, raw_price: str) -> float:
"""Convert GMX raw price to human readable USD value"""
decimals = determine_price_decimals(token_symbol, raw_price)
return float(Decimal(raw_price) / Decimal(10**decimals))
def get_gmx_tickers_data(config: GMXConfig) -> pd.DataFrame:
"""Get GMX ticker data and convert to structured DataFrame"""
api = GMXAPI(config)
tickers = api.get_tickers()
# Convert to DataFrame
df = pd.DataFrame(tickers)
# Convert timestamps
df['updatedAt'] = pd.to_datetime(df['updatedAt'], unit='ms')
df['timestamp'] = pd.to_datetime(df['timestamp'], unit='s')
# Convert prices using appropriate decimal precision per token
df['minPrice_usd'] = df.apply(
lambda row: convert_gmx_price(row['tokenSymbol'], row['minPrice']), axis=1
)
df['maxPrice_usd'] = df.apply(
lambda row: convert_gmx_price(row['tokenSymbol'], row['maxPrice']), axis=1
)
# Calculate mid price and spread
df['midPrice_usd'] = (df['minPrice_usd'] + df['maxPrice_usd']) / 2
df['spread_usd'] = df['maxPrice_usd'] - df['minPrice_usd']
df['spread_bps'] = (df['spread_usd'] / df['midPrice_usd']) * 10000
# Add raw prices for reference
df['minPrice_raw'] = df['minPrice']
df['maxPrice_raw'] = df['maxPrice']
# Reorder columns
columns_order = [
'tokenSymbol', 'tokenAddress',
'minPrice_usd', 'maxPrice_usd', 'midPrice_usd',
'spread_usd', 'spread_bps',
'timestamp', 'updatedAt',
'minPrice_raw', 'maxPrice_raw'
]
return df[columns_order]
# Setup connection
json_rpc_url = os.environ.get("ARBITRUM_CHAIN_JSON_RPC")
if not json_rpc_url:
json_rpc_url = input("Enter Arbitrum RPC URL: ")
web3 = create_multi_provider_web3(json_rpc_url)
config = GMXConfig(web3)
print("Fetching GMX ticker data...")
# Get and process ticker data
tickers_df = get_gmx_tickers_data(config)
# Show selected tokens
print("\nMajor Token Prices:")
print('-' * 50)
major_tokens = ['BTC', 'ETH', 'USDC', 'USDT', 'SOL', 'LINK', 'ARB']
major_df = tickers_df[tickers_df['tokenSymbol'].isin(major_tokens)]
for _, row in major_df.iterrows():
print(f"{row['tokenSymbol']}: ${row['midPrice_usd']:.2f} (Spread: {row['spread_bps']:.2f} bps)")
Fetching GMX ticker data...
Extracting OHLC Data
Let’s create our first function to extract OHLC data from the GMX API:
[14]:
from eth_defi.gmx.config import GMXConfig
import pandas as pd
def get_gmx_ohlc_data(config: GMXConfig, token_symbol: str = "ETH", period: str = "1h") -> pd.DataFrame:
"""Fetch OHLC (Open, High, Low, Close) price data from GMX API.
GMX provides historical price data through their API, which aggregates price information
from their on-chain oracle feeds. This data represents actual trading prices
available on the GMX platform.
:param config: GMX configuration object containing Web3 connection details
:param token_symbol: Trading pair symbol (ETH, BTC, LINK, ARB, etc.)
:param period: Time interval - supported: 1m, 5m, 15m, 1h, 4h, 1d
:return: DataFrame with columns [timestamp, open, high, low, close] or empty if no data
"""
gmx_api = GMXAPI(config)
# Request candlestick data from GMX API
raw_data = gmx_api.get_candlesticks(token_symbol, period)
if not raw_data or "candles" not in raw_data:
print(f"No candlestick data received for {token_symbol}")
return pd.DataFrame()
candles = raw_data["candles"]
if not candles:
print(f"Empty candles array for {token_symbol}")
return pd.DataFrame()
# Validate data structure - ensure we have at least OHLC data
num_fields = len(candles[0]) if candles else 0
if num_fields >= 5:
# Standard OHLC format: timestamp, open, high, low, close
columns = ["timestamp", "open", "high", "low", "close"]
df = pd.DataFrame(candles, columns=columns)
# Convert Unix timestamps to Python datetime objects
df["timestamp"] = pd.to_datetime(df["timestamp"], unit="s")
print(f"Successfully retrieved {len(df)} {period} candles for {token_symbol}")
return df
print(f"Insufficient data fields ({num_fields}) for {token_symbol}")
return pd.DataFrame()
# Example usage
ohlc_df = get_gmx_ohlc_data(config, "ETH", "1h")
print(f"Retrieved {len(ohlc_df)} hourly candles for ETH")
print(ohlc_df.head())
Successfully retrieved 1000 1h candles for ETH
Retrieved 1000 hourly candles for ETH
timestamp open high low close
0 2025-09-16 07:00:00 4509.48 4514.90 4502.90 4511.27
1 2025-09-16 06:00:00 4530.00 4536.71 4494.04 4509.48
2 2025-09-16 05:00:00 4520.07 4533.83 4512.97 4530.00
3 2025-09-16 04:00:00 4521.66 4524.67 4489.36 4520.07
4 2025-09-16 03:00:00 4514.89 4533.02 4514.68 4521.66
Understanding Period Parameters
1m: 1-minute candles - 5m: 5-minute candles15m: 15-minute candles - 1h: 1-hour candles - 4h: 4-hour candles - 1d: 1-day candlesExtracting On-Chain Market Data
Now let’s extract complementary on-chain data:
[10]:
from eth_defi.gmx.data import GMXMarketData
def get_gmx_markets_info(config: GMXConfig) -> dict:
"""Retrieve comprehensive market information from GMX protocol.
This function fetches current market state including:
- Available trading pairs and their configurations
- Total Value Locked (TVL) in each market
- Open Interest (total position sizes) for long/short positions
:param config: GMX configuration object
:return: Dictionary containing markets, TVL, and open interest data
"""
gmx_data = GMXMarketData(config)
# Fetch all market data concurrently for efficiency
markets = gmx_data.get_available_markets()
tvl_data = gmx_data.get_pool_tvl()
oi_data = gmx_data.get_open_interest()
return {
"markets": markets,
"tvl": tvl_data,
"open_interest": oi_data
}
# Example usage
market_info = get_gmx_markets_info(config)
print("Available markets:", list(market_info["tvl"].keys()))
09/16/2025 12:14:10 AM INFO: About to perform 90 multicalls
09/16/2025 12:14:13 AM INFO: Performed 90 calls, succeed: 90, failed: 0
Available markets: ['BTC', 'ETH', 'DOGE', 'SOL', 'LTC', 'UNI', 'LINK', 'ARB', 'XRP', 'BNB', 'AAVE', 'ATOM', 'NEAR', 'AVAX', 'OP', 'BTC2', 'ETH2', 'GMX', 'PEPE', 'WIF', 'wstETH', 'SHIB', 'APE_DEPRECATED', 'STX', 'ORDI', 'EIGEN', 'SATS', 'POL', 'APE', 'SUI', 'SEI', 'APT', 'TIA', 'TRX', 'TON', 'TAO', 'BONK', 'WLD', 'BOME', 'MEME', 'FLOKI']
Drawing OHLCV chart
Let’s create a function to generate an OHLC chart using Plotly:
[ ]:
# To make the output a static image instead of dynamic, we need these 3 lines
from eth_defi.research.notebook import setup_charting_and_output, OutputMode, set_large_plotly_chart_font
setup_charting_and_output(OutputMode.static, image_format="png", width=1500, height=1000, increase_font_size=False)
set_large_plotly_chart_font()
import plotly.graph_objects as go
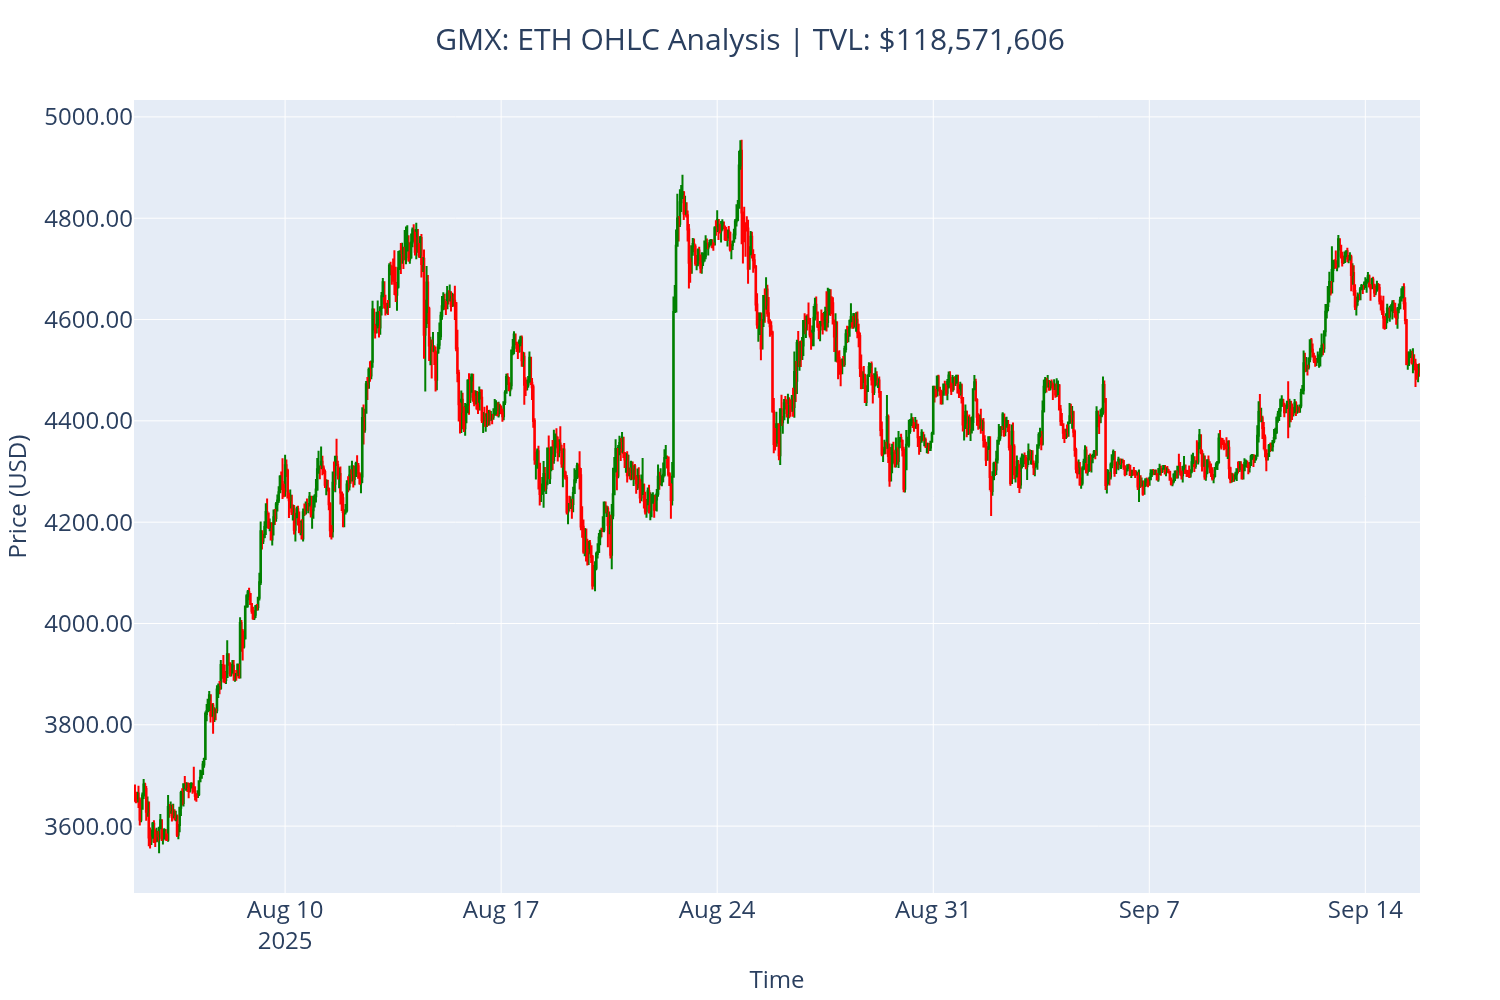
def create_ohlc_chart(
df: pd.DataFrame,
token_symbol: str,
market_info: dict = None,
title_suffix: str = ""
) -> go.Figure:
"""Create a candlestick chart from OHLC price data.
This function generates a professional candlestick chart that visualizes price movements
over time. Green candles represent bullish periods, red candles show bearish periods.
:param df: DataFrame containing OHLC data
:param token_symbol: Symbol to display in chart title
:param market_info: Optional market data to include TVL in title
:param title_suffix: Additional text for chart title
:return: Plotly Figure object ready for display
"""
if df.empty:
print(f"Cannot create chart: no data provided for {token_symbol}")
return None
# Initialize Plotly figure with candlestick chart
fig = go.Figure()
# Add OHLC candlestick trace with custom styling
fig.add_trace(
go.Candlestick(
x=df["timestamp"],
open=df["open"],
high=df["high"],
low=df["low"],
close=df["close"],
name="Price",
increasing_line_color='green', # Bullish candle borders
decreasing_line_color='red', # Bearish candle borders
increasing_fillcolor='rgba(0,255,0,0.3)', # Bullish candle fill
decreasing_fillcolor='rgba(255,0,0,0.3)' # Bearish candle fill
)
)
# Build informative chart title with market data
title_parts = [f"GMX: {token_symbol} OHLC Analysis"]
if title_suffix:
title_parts.append(title_suffix)
# Add TVL information if available
if market_info and "tvl" in market_info:
for market_symbol, tvl_data in market_info["tvl"].items():
if token_symbol.upper() in market_symbol.upper():
tvl_value = tvl_data['total_tvl']
# Handle potential decimal precision issues
if tvl_value > 1e15: # Convert from wei if needed
tvl_value = tvl_value / 1e18
if 1000 <= tvl_value <= 1e11:
title_parts.append(f"TVL: ${tvl_value:,.0f}")
break
# Configure chart layout
fig.update_layout(
title=" | ".join(title_parts),
height=500,
showlegend=False,
xaxis_rangeslider_visible=False
)
# Customize axis labels
fig.update_yaxes(title_text="Price (USD)", tickformat=".2f")
fig.update_xaxes(title_text="Time")
return fig
# Example usage
fig = create_ohlc_chart(ohlc_df, "ETH", market_info)
fig.show()
09/16/2025 12:21:33 AM INFO: Chromium init'ed with kwargs {}
09/16/2025 12:21:33 AM INFO: Found chromium path: /usr/bin/google-chrome
09/16/2025 12:21:33 AM INFO: Temp directory created: /tmp/tmp16z6phw2.
09/16/2025 12:21:33 AM INFO: Opening browser.
09/16/2025 12:21:33 AM INFO: Temp directory created: /tmp/tmpzv8t6fux.
09/16/2025 12:21:33 AM INFO: ldd failed. e: Command '['ldd', '/usr/bin/google-chrome']' returned non-zero exit status 1., stderr: None
09/16/2025 12:21:33 AM INFO: Temporary directory at: /tmp/tmpzv8t6fux
09/16/2025 12:21:33 AM INFO: Conforming 1 to file:///tmp/tmp16z6phw2/index.html
09/16/2025 12:21:33 AM INFO: Waiting on all navigates
09/16/2025 12:21:35 AM INFO: All navigates done, putting them all in queue.
09/16/2025 12:21:35 AM INFO: Getting tab from queue (has 1)
09/16/2025 12:21:35 AM INFO: Got E4AB
09/16/2025 12:21:35 AM INFO: Processing GMX_ETH_OHLC_Analysis__TVL_118571606.png
09/16/2025 12:21:35 AM INFO: Sending big command for GMX_ETH_OHLC_Analysis__TVL_118571606.png.
09/16/2025 12:21:36 AM INFO: Sent big command for GMX_ETH_OHLC_Analysis__TVL_118571606.png.
09/16/2025 12:21:36 AM INFO: Reloading tab E4AB before return.
09/16/2025 12:21:36 AM INFO: Putting tab E4AB back (queue size: 0).
09/16/2025 12:21:36 AM INFO: Waiting for all cleanups to finish.
09/16/2025 12:21:36 AM INFO: Exiting Kaleido
09/16/2025 12:21:36 AM INFO: TemporaryDirectory.cleanup() worked.
09/16/2025 12:21:36 AM INFO: shutil.rmtree worked.
09/16/2025 12:21:36 AM INFO: Cancelling tasks.
09/16/2025 12:21:36 AM INFO: Exiting Kaleido/Choreo
09/16/2025 12:21:36 AM INFO: Closing browser.
09/16/2025 12:21:36 AM INFO: TemporaryDirectory.cleanup() worked.
09/16/2025 12:21:36 AM INFO: shutil.rmtree worked.
09/16/2025 12:21:36 AM INFO: Cancelling tasks.
09/16/2025 12:21:36 AM INFO: Exiting Kaleido/Choreo
09/16/2025 12:21:36 AM INFO: Closing browser.
09/16/2025 12:21:38 AM INFO: TemporaryDirectory.cleanup() worked.
09/16/2025 12:21:38 AM INFO: shutil.rmtree worked.
Interpreting the Results
Understanding Candlestick Charts
Chart Elements:
Green candles: Bullish periods where closing price > opening price
Red candles: Bearish periods where closing price < opening price
Body (thick part): Shows opening and closing prices
Wicks (thin lines): Show highest and lowest prices during the period
Market Indicators:
TVL (Total Value Locked): Indicates market size and available liquidity
Price range: Shows volatility and potential trading opportunities
Analysing Price Statistics
The tutorial provides several key metrics:
Data period: Time range of the analysis
Price range: Minimum and maximum prices during the period
Latest price: Most recent closing price
Total change: Absolute and percentage price movement
Practical Applications
Use this analysis for:
Trading decisions: Identify support/resistance levels
Risk management: Understand price volatility patterns
Market timing: Spot potential entry/exit points
Portfolio analysis: Track performance over time
Conclusion
This tutorial covered the essential aspects of analysing GMX price data using Python and the eth_defi library. You learned how to:
Set up connections to GMX on Arbitrum
Fetch and process OHLC price data
Create professional candlestick charts
Analyse market statistics and trends
Configure output for different use cases
The techniques demonstrated here form the foundation for more advanced DeFi analysis, including:
Automated trading strategies
Risk management systems
Portfolio optimisation
Market monitoring tools
Continue exploring the eth_defi library to discover more powerful features for blockchain data analysis.